The hottest topic in real estate at the moment is whether or not there is a so called “property bubble”.
The best way to define a bubble is when property price rises more rapidly than the long term trend line.
The long term trend line reflects “normal” growth. This long term growth reflects underlying factors such as supply and demand and economy wide inflation. In times when interest rates are low, speculation becomes an “abnormal” factor and short term pressures build. Central banks and regulators have a role to play using interest rates and rules to dampen demand.

Sydney aside, let me give an example from a relatively quiet capital city market – Adelaide. A house that I am familiar with recently sold for $1,000,000. What is unusual is that it had been held by the same owner for 70 years – purchased originally for $4,000.
70 years is long enough to have seen multiple housing cycles – any growth over that period is by definition “normal” growth. Even in quiet little Adelaide that represents 7.5% compound growth for 70 years. That is the power of compound interest. At 7.5% compound growth value doubles roughly every 10 years. $4,000 to $1,000,000 – hard to believe isn’t it. Try it – start with $4000 and double it 8 times = $1,012,000!
Is that a bubble? Absolutely not. Have there been times in between 1948 and 2018 when Adelaide has been over exuberant…? Ha-ha, probably but I don’t recall.
An almost identical house in Camp Hill in Brisbane – sold recently for $1,100,000 and bought for $4,000 and held by the same owner for 71 years. Remarkably similar!! (information supplied by PS Property Advisory.)
This story could be repeated in any capital city.
Has Sydney been in a bubble recently? Once again I have some personal experience – shifting to Sydney in 2002 and needing to buy a home. The value of Sydney property did very little for the next decade (to 2012) and then it certainly played catch up between 2012-2015, then as happens in property cycles, exuberance took over. Sydney median house price has now fallen, and if you look carefully (see a. in graph below) it is now virtually right back on the long term trend line. That however is not the full cycle. Assuming this one follows similar cycles, price will dawdle lower still for several years to come until it falls back below that trend line.

But is Sydney housing over priced at the moment? History would suggest not.
What will happen in other cities?
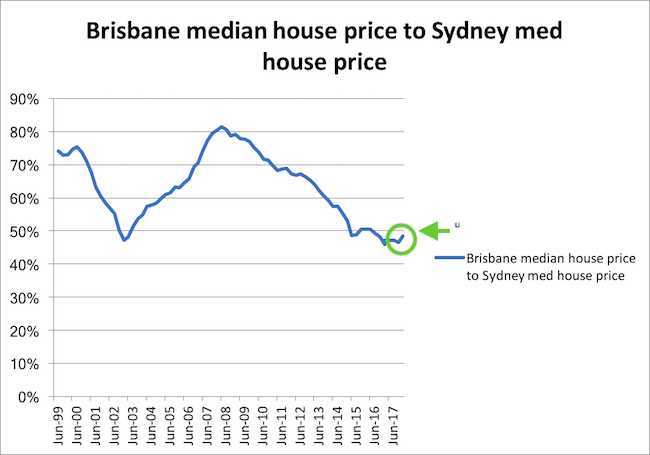
Typically, when Sydney is “out of its growth cycle” then the “greener grass” value of other cities begins to have appeal. To pick Brisbane as another example, as Sydney price dawdles lower and Brisbane dawdles higher, then the value (relative to Sydney) of the “other” capitals – Canberra, Brisbane, Hobart, Adelaide eventually peak in coming years. Those other capitals are now at the beginning of a fairly long upward trend. (I leave Perth and Darwin out – where values run much more hot and cold due to being heavily influenced by mining cycles.)

Anyone who owns a house hopes for capital growth, anyone who is waiting to buy hopes for a downturn. Markets don’t respond to an individual’s hope, markets do however follow long term trends.
Whether you are buying your family home, or using property as a long term investment vehicle – the trend really is your friend. Another truism (which is in fact true) is that it is much more about “time in the market” than it is about “timing the market” There are as many winners as there are losers in the short term speculation market – that’s how it goes.
For anyone who holds property for the long term in a solid segment (which I would call capital cities simply because of their size) eventually everyone wins.
Ask Alan
@mortgagebrokeratyourfingertips
alan.heath@askalanheath.com.au 0411 601 459

